Revealing housing and construction trends with AI
See how Solutions Engineer Sam Mason used AI-derived property insights and frequently updated imagery to reveal housing and construction trends in Christchurch, Aotearoa New Zealand.

Belfast, Christchurch
At Nearmap, our imagery is known for providing a crystal clear picture of the truth of the ground — but it’s the insights that can be derived from our content that turns imagery into actionable property intelligence. Since we fly throughout the year we’ve built up a great library of what’s going on in the world in both time and space.
In September 2025 we were in Otautahi Christchurch at the Esri User Conference and in response to many of the questions we were asked, we wanted to demonstrate how you can turn our imagery into actionable insights with AI derived spatial datasets — specifically, what can we see in terms of construction and housing trends over the Christchurch area over the last few years.
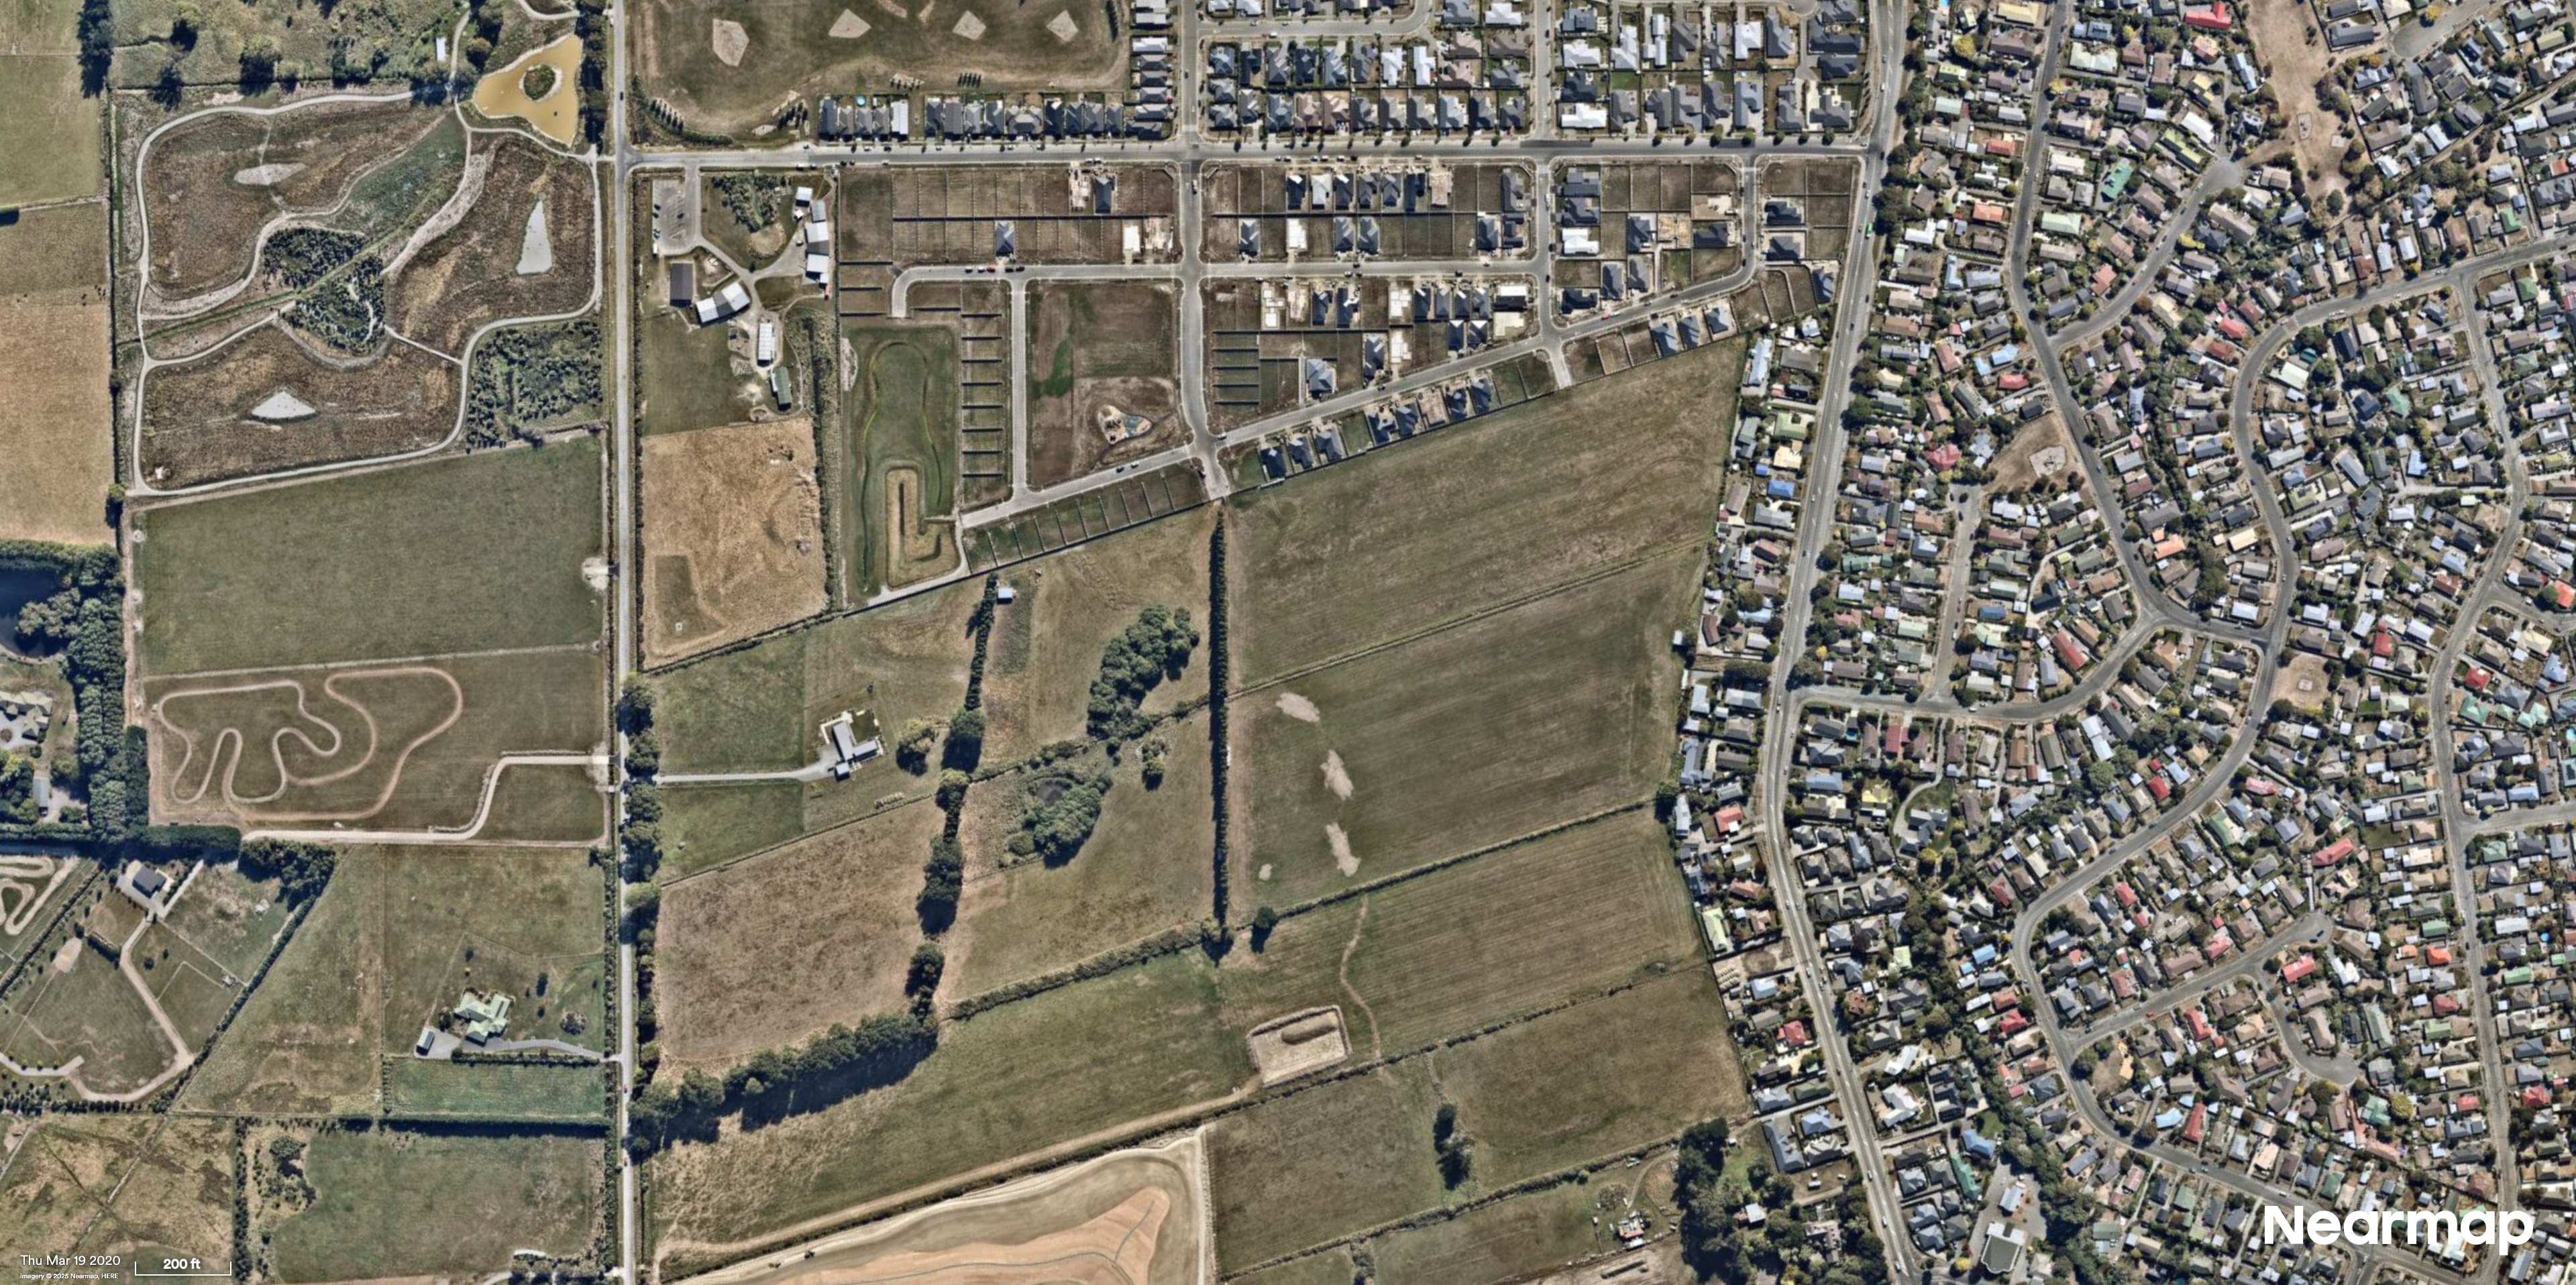
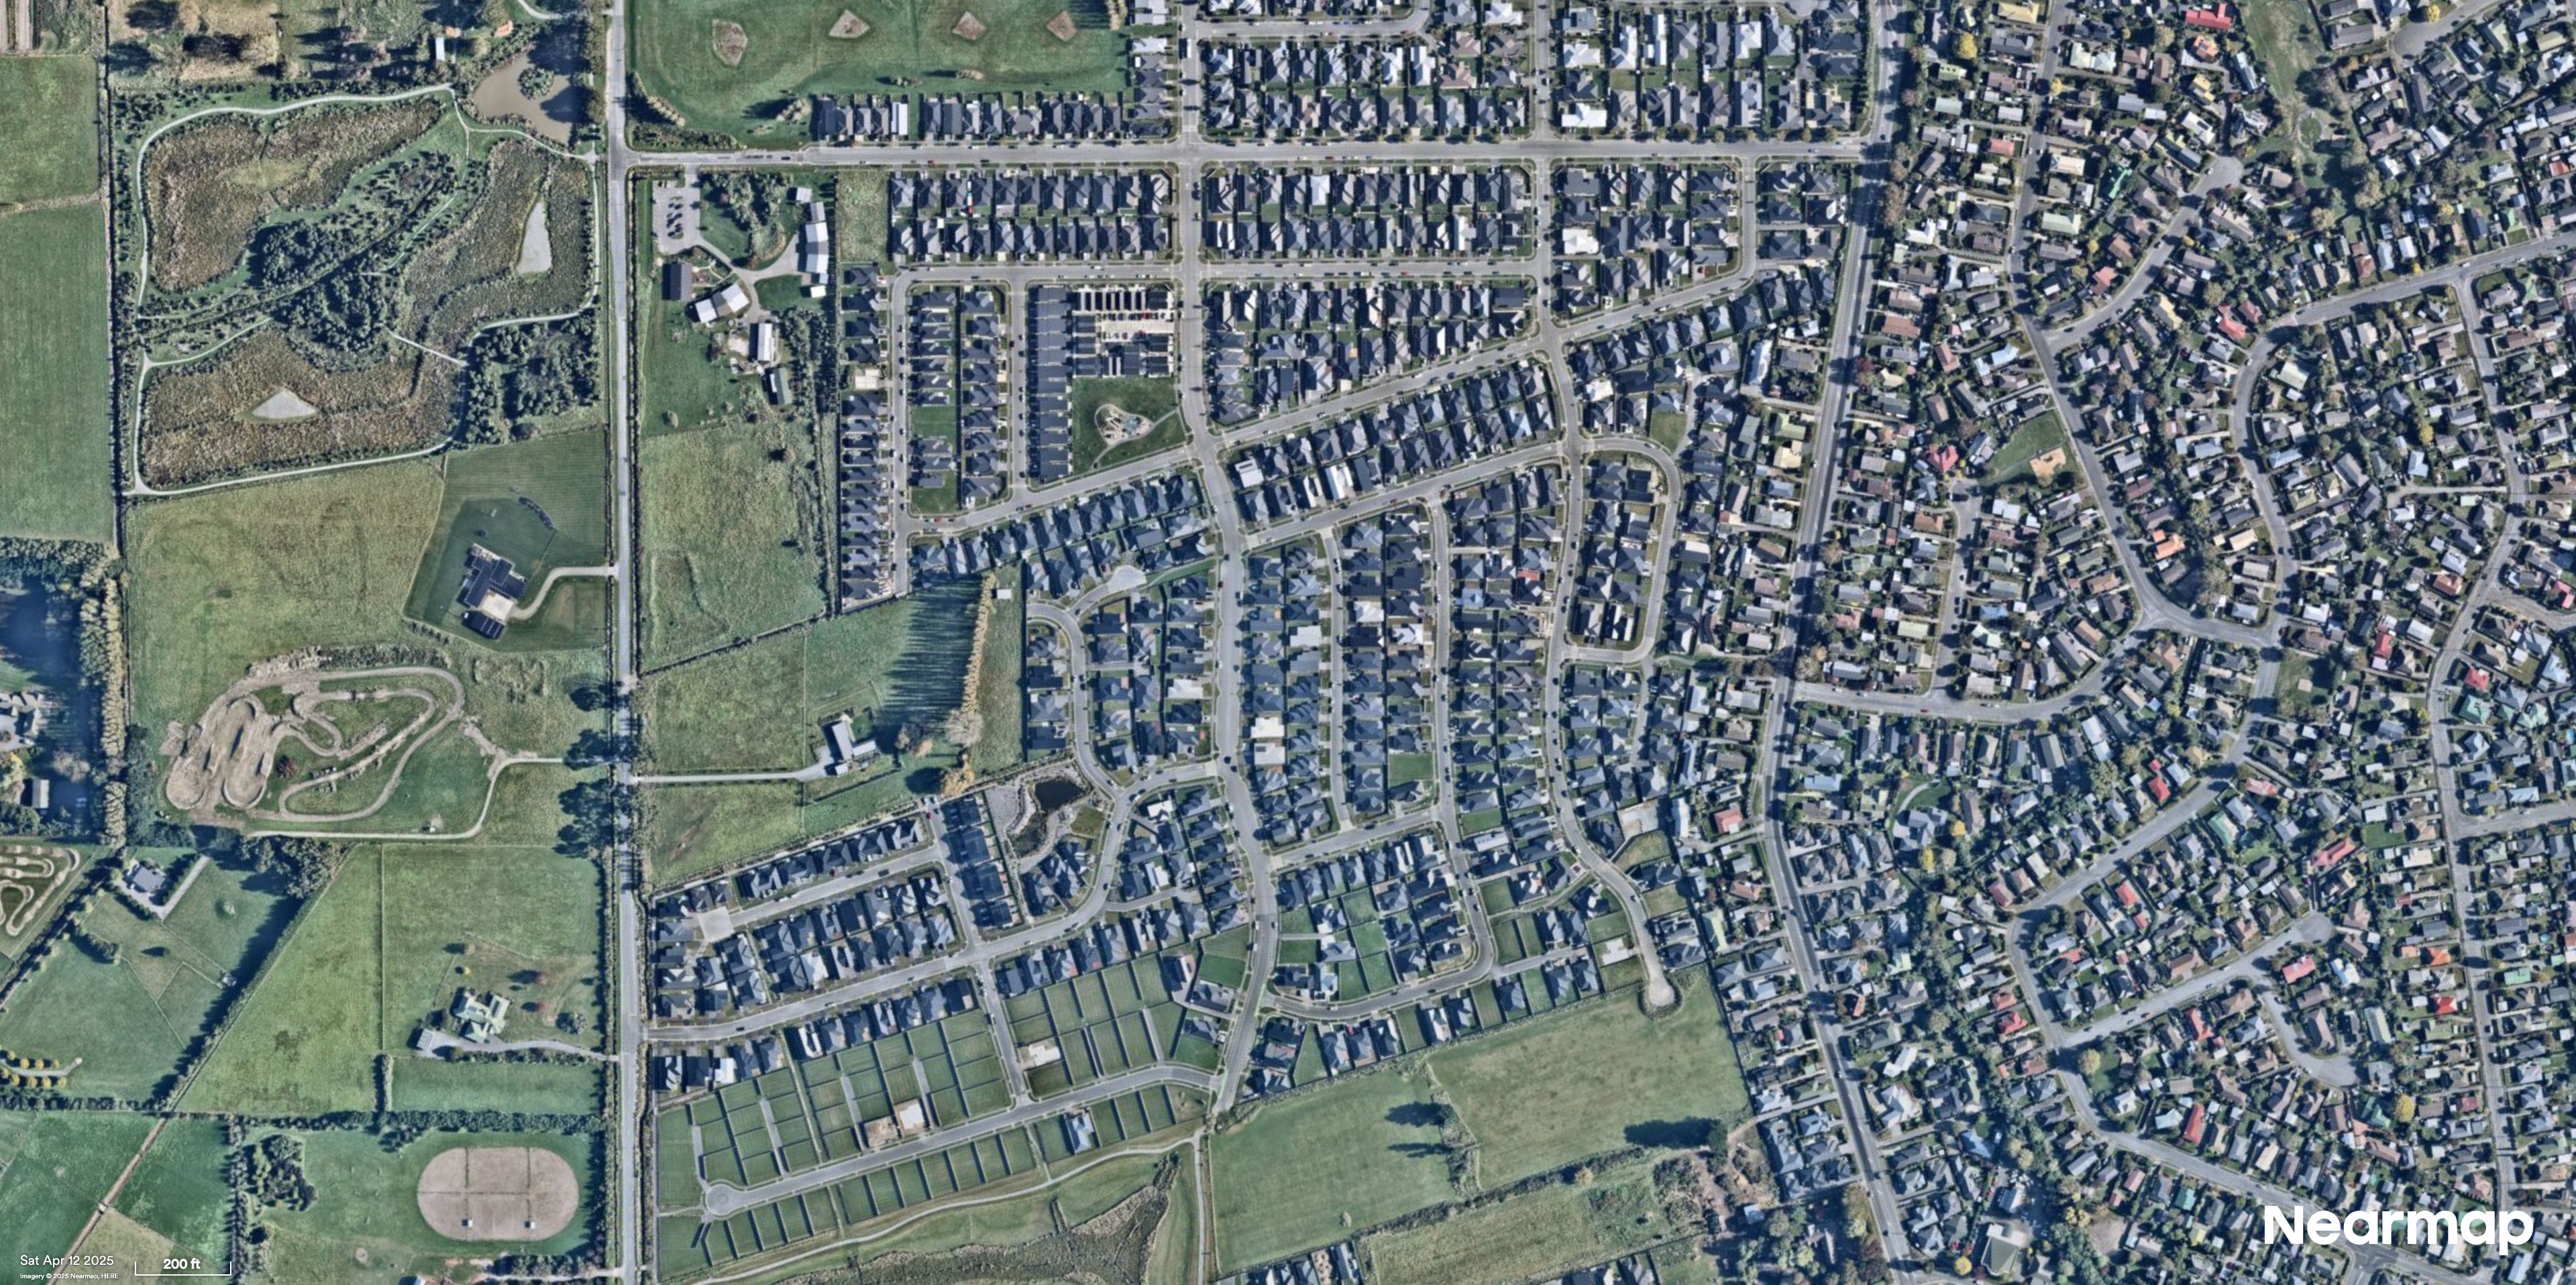
Halswell, Christchurch
We have developed a number of AI solution packs that bundle together related sets of features in the world based on many of our market use cases. In this case we used our building footprints and construction packs which together allow us to detect buildings and roofs as well as buildings under active construction, construction vehicles and cranes — which is more than enough information to get started on!
With that in mind we started pulling large scale spatio-temporal data through our APIs and to see what we could find. The actual area consisted of 89 suburbs in and around the Christchurch metropolitan area (roughly 488 km² covering a population of about 413,000). Since we’ve been flying over there since 2017, we have a lot of historical captures to choose from so it was easy to pick six points in time between 2020 and 2025 and have a look at what’s changed over the last five years.
We then set out to answer two related but separate questions. Firstly how and where has housing density changed since 2020 and secondly which suburbs have seen the most construction activity overall?
Growth in housing density
To start with we can count the number of houses we see in every suburb at each time point and work out how much that has changed. As a rough approximation to “houses”, we’ll use the roof layer and count all roof features greater than about 10 square metres. This will filter out most of the garden sheds and granny flats out there and remember — even though many properties have more than one roof, it’s the change in the number of these that we care about here — so any over-counting will cancel out.
But we also have a lot of suburbs of varying sizes — McLeans Island is 137 times bigger than the smallest suburb of Moncks Bay so if we’re going to compare them we also need to control for that. The easiest way to do this is to calculate the number of houses per square kilometre which we’ll call the “housing density”.
From there it’s easy to find out where the densest suburbs are — the below table shows the top five suburbs by density as of April 2025:
Suburb | Approx. houses per km² |
|---|---|
Aranui | 1953 |
Spreydon | 1911 |
Bishopdale | 1800 |
Bryndwr | 1775 |
Somerfield | 1714 |
Since humans are great at processing spatial patterns visually, we also want to generate some heatmaps. This will allow us to see which suburbs saw higher than average growth in housing density (the “hotspots”) and which saw relatively less (the “coldspots”). To help bring out this pattern we’ll colour the hotspots in darker reds and leave the areas with less growth lighter reds and whites.
When we do this for the 2020–2021 and 2024–2025 periods (pictured above), some interesting overall spatial trends immediately jump out. At the start of our time window, most of the growth in housing density was to the north east of the Christchurch CBD in suburbs such as Belfast and Marshland as well in the inner western suburbs such as Russley and Broomfield. In contrast, since 2024 housing growth is roughly evenly distributed radially around the CBD in the far outer suburbs such as McLeans Island, Templeton and Kennedy’s Bush.
So at a large scale, it appears that the overall pattern has reversed. Initially, most growth occurred in the CBD region and surrounding inner suburbs, surrounded by a ring of less activity and with the exception of the south-west region, the outer suburbs had comparatively less growth at the time. Yet fast forward to the present and the outer suburbs show the greatest changes in growth whilst the inner region has largely stalled.

AI Layers
Christchurch central
Construction activity
So what exactly do we mean by “construction activity” and how could we measure it anyway? There are some economic indexes already in use in industry but we want to be a bit more hands on and get a bit of analytical dirt under our fingernails (so to speak). Well it turns out that one of our original AI Packs is the construction pack which, as we said earlier, we can use to determine overall construction activity by combining plant and activity with overall development growth.
But before we get clever we can simply look at some numbers over the whole period and see what they tell us. Between 2020 and 2025 we saw the most construction cranes (26) in the Christchurch central area which should come as no surprise since cranes will be where the taller more commercial buildings are. And if we also include the total number of buildings actively under construction during this period (see the below table) we learn that just three suburbs alone account for more than about 21% of the overall construction events over the whole period.
Suburb | Buildings Under Construction | Cranes |
|---|---|---|
Halswell | 168 | 2 |
Christchurch Central | 99 | 26 |
St Albans | 83 | 0 |
However that’s not the whole story. The CBD area is in the top three because it has so many cranes but as we saw above housing growth flatlines there in more recent years. So we need a way to flatten the playing field here and tease out what’s really happening.
One way to do this is to fit a separate trend model to each suburb to get a rate of growth for each which we’ll turn into a “housing index” which goes from 0 to 1. Then we can make a “construction index” by combining all the cranes and buildings under construction into another number (also between 0 and 1). Finally, if we take the average of these two numbers we get an unbiased overall indicator of construction activity of the whole period — and the story changes dramatically.
What’s happening here is that we’re taking into account multiple factors at once and no longer letting commercial construction overshadow activity in the outlying areas. The result is that Christchurch Central drops from second down to 35th place in the list of the most active suburbs overall whereas Halswell remains the clear overall leader in construction activity with Belfast and Marshland coming in at second and third place.

Spatially, the above image shows the overall pattern where the darker blue suburbs are the ones with the highest observed activity and the lighter ones with the least. This tells a similar story as we saw in our first question — most construction activity is happening to the north east and south west of the CBD. However one difference here is that the far outer suburbs have relatively less active work in progress.
The Otautahi Christchurch construction story over the last five years is one bounded by geography. Potential areas for new developments are limited by the Waimakariri River to the north, Diamond Harbour to the south and the Pacific Ocean to the east. Much like us over here in Sydney, the only places to go are out onto the (south) western plains so we shouldn’t be surprised to see these trends.
So what to make of all of this? Well at Nearmap we like to observe and think rather than try to invent explanations. However if we had to guess, we can point out that this spatio-temporal trend is similar to other trends we have observed in Australian cities during the period after COVID-19 lockdowns. That is, generally an initial surge in economic and construction activity in the inner suburbs through 2020/2021 followed by a shift to the outer suburbs over the next few years. Whatever the causes are, this is a fine example of Nearmap content powering property intelligence allowing us to hold up a stethoscope and hear the heartbeat of a living breathing city.
Ready to see what insights you could derive from our AI datasets and high-resolution imagery? Get a tailored demo, and we’ll show you how property intelligence can transform your spatial analysis and decision-making processes.
*Nearmap does not warrant, or accept any liability in relation to, the accuracy, correctness or reliability of the data provided as part of this analysis which is based on Nearmap AI data. The national aerial data was collected from six capture dates 2020-03-19, 2021-03-13, 2022-04-14, 2023-05-02, 2024-04-16 and 2025-04-12. Results were aggregated at suburb level using the 2025 LINZ definitions (https://data.linz.govt.nz/layer/113764-nz-suburbs-and-localities/). 89 suburbs were included in the analysis, where Nearmap AI coverage exceeded 99%. Roof features were filtered. All percentage figures have been rounded to the closest whole number.

About the author
Sam Mason is a geospatial statistician interested in ecology and species distribution modelling. He has researched spatio-temporal energy distributions and is a PhD candidate with the UNSW EcoStats Research group. He joined the Nearmap AI team in 2017 and is a Solutions Engineer helping customers get maximum value from Nearmap content.